Why Full Signal Bars Still Give Slow Internet in India

Full signal bars can be misleading. Many mobile users in India experience the same frustrating situation: the phone shows strong 4G or 5G signal, but web pages load slowly, videos buffer, WhatsApp calls break, and speed tests fluctuate badly. This feels illogical because we are trained to think “more bars = better internet.”
In real telecom systems, signal bars mostly represent signal strength, not the full quality or capacity of the connection. A phone may hear the tower very loudly, but that does not mean the tower has enough free spectrum, clean radio conditions, low interference, available scheduler resources, or sufficient backhaul capacity to serve everyone well.
That is why full signal bars can still give slow internet in India. The issue is not only “coverage.” It is often a mixture of congestion, poor SINR, overloaded towers, weak backhaul, indoor penetration loss, and crowded cells.
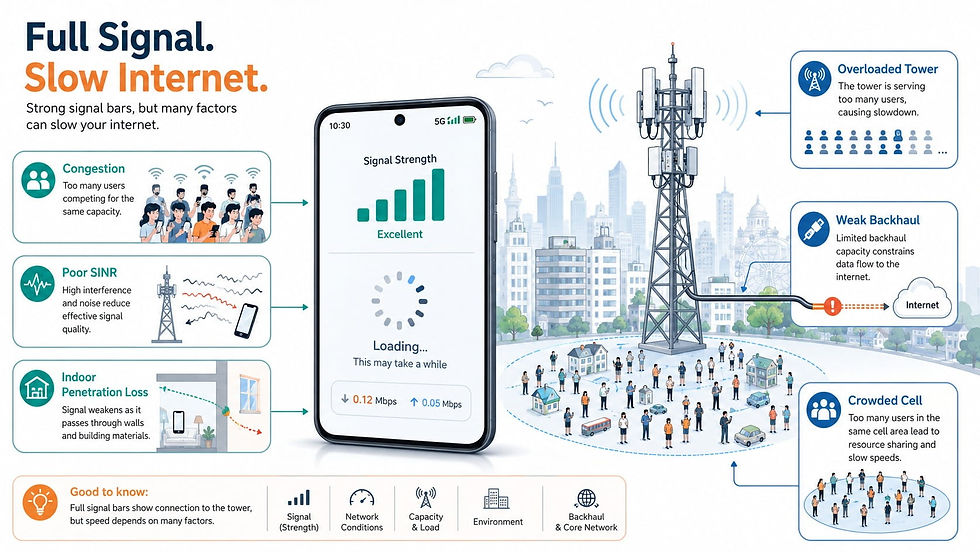
Signal Bars Measure Coverage, Not Internet Speed
Signal bars are a simplified user-interface indicator. They usually depend on measurements such as RSRP in LTE and 5G NR.
In LTE, RSRP means Reference Signal Received Power. In 5G, similar measurements exist for synchronization and reference signals. RSRP tells the phone how strong the serving cell’s reference signal is.
A simplified way to think about received power is:
Pᵣ = Pₜ + Gₜ + Gᵣ - Lₚ - Lₒ
Where:
Pᵣ = Received power at the phone
Pₜ = Transmit power from the base station
Gₜ = Base station antenna gain
Gᵣ = Phone antenna gain
Lₚ = Path loss through distance and environment
Lₒ = Other losses such as walls, body loss, foliage, cables, and clutter
If Pᵣ is strong, your phone may show full bars. But internet speed depends on much more than received power.
A good mobile data connection needs:
Strong enough signal,
Low interference,
Enough free spectrum resources,
Good modulation and coding,
Enough tower capacity,
Enough backhaul capacity,
And low congestion in the core and ISP path.
So full bars only answer one question: Can my phone hear the tower well?
They do not answer: Can the tower serve me fast right now?
SINR: The Missing Number Behind Slow Internet
The most important hidden metric is often SINR, or Signal-to-Interference-plus-Noise Ratio.
SINR = S/(I + N)
Where:
S = Useful signal power from the serving cell
I = Interference from other cells, users, or radio sources
N = Thermal noise and receiver noise
In dB form:

A phone may have strong signal, but if interference is also strong, SINR becomes poor. This is common in dense Indian cities where many towers, sectors, repeaters, and users operate in the same or nearby frequency bands.
For example, your phone may receive a strong signal from the serving tower, but it may also receive strong interfering signals from neighboring cells. The bars still look good because RSRP is high. But the usable signal quality is bad because the phone struggles to separate the wanted signal from interference.
This affects the modulation scheme. With good SINR, the network can use higher-order modulation such as 64-QAM or 256-QAM, carrying more bits per symbol. With poor SINR, it must fall back to more robust but slower modulation such as QPSK.
A simplified capacity relationship is given by Shannon’s formula:
C = B log₂ (1 + SINR)
Where:
C = Theoretical channel capacity in bits per second
B = Bandwidth in Hz
SINR = Linear signal-to-interference-plus-noise ratio
This equation explains why signal quality matters so much. Increasing bandwidth helps, but poor SINR limits how efficiently that bandwidth can be used.

Congestion: When Too Many Users Share the Same Cell
Mobile networks are shared systems. A tower sector does not give each user a private highway. It divides radio resources among many active users.
In LTE and 5G, the scheduler assigns time-frequency resources to users. In LTE, these are resource blocks. In 5G NR, similar scheduling happens across physical resource blocks, slots, and numerologies.
If a cell has 100 active users and limited spectrum, each user gets only a fraction of the available resources. The phone can still show full bars because the serving cell is nearby, but the cell may be crowded.
A simplified user throughput model is:
Rᵤ ≈ η × B × Rₐ/Rₜ
Where:
Rᵤ = Approximate user throughput
η = Spectral efficiency in bits/s/Hz
B = Available channel bandwidth
Rₐ = Resources allocated to that user
Rₜ = Total available radio resources in the cell
Even if B is large and signal strength is high, your speed falls if your allocated resource share is small.
This is why mobile internet often slows down in:
Markets,
Railway stations,
Colleges,
Apartments,
Office districts,
Festivals,
Stadiums,
... and evening peak hours.
India has very high mobile data consumption. In many locations, the issue is not lack of coverage but lack of capacity per user. Operators can improve this by adding spectrum, small cells, carrier aggregation, massive MIMO, sector splitting, or new tower sites. But each option has cost, site-acquisition, power, fiber, and regulatory constraints.
Overloaded Towers and Crowded Cells
An overloaded tower is not just a tower with many connected users. The real issue is how many users are actively demanding data at the same time and how much spectrum the tower has available.
A single macro tower may cover a large area. If that area contains dense housing, shops, offices, and roads, many users attach to the same cell. This creates a crowded cell.
Crowded cells cause several problems:
First, the scheduler becomes resource-starved. Every user waits longer for radio resources.
Second, control channels also become loaded. Even before data transfer, phones need signaling for access, handover, paging, and scheduling.
Third, uplink performance can degrade badly. The phone has much lower transmit power than the tower. So even when downlink looks acceptable, uploads, video calls, and voice-over-LTE behavior can suffer.
Fourth, users at the cell edge consume more resources. A weak or interference-heavy user may require robust coding and retransmissions. That means the cell spends more time delivering fewer useful bits.
This creates an important engineering trade-off: maximizing coverage is not the same as maximizing capacity. A large cell can cover more users, but a smaller cell layout can reuse spectrum more aggressively and improve per-user speeds.

Weak Backhaul: When the Tower Is Fast but the Pipe Behind It Is Not
Even if the radio side is healthy, traffic still has to travel from the tower to the operator’s transport network and then to the internet. This connection is called backhaul.
A mobile data path looks roughly like this:
Phone → Tower/RAN → Backhaul → Core Network → Internet/Content Server
Backhaul may use fiber, microwave, or a combination of transport links. Fiber generally provides high capacity and lower latency. Microwave can be excellent too, but capacity depends on spectrum, channel width, modulation, hop design, weather margin, and licensing.
If the tower has insufficient backhaul, users experience slow speeds even with good radio signal. This is common where radio upgrades happen faster than transport upgrades. For example, an operator may deploy 5G radio equipment, but if the site backhaul is not scaled properly, the user will not experience true 5G-like performance.
A simplified bottleneck rule is:

Your final speed is limited by the weakest segment in the chain.
This is why two locations with the same signal strength can behave very differently. One tower may have strong fiber backhaul and low load. Another may have similar radio coverage but weak transport capacity, overloaded aggregation links, or congestion deeper in the network.
Indoor Penetration: Full Bars Can Still Hide Bad Radio Quality
Indoor coverage is complicated. Indian buildings often use concrete, brick, metal grills, coated glass, dense walls, and basement-like interiors. These materials attenuate radio signals.
Penetration loss depends heavily on frequency. Lower bands such as 700 MHz, 850 MHz, or 900 MHz penetrate better. Mid-bands such as 1800 MHz, 2100 MHz, 2300 MHz, 2500 MHz, and 3500 MHz provide more capacity but usually suffer higher indoor loss.
Free-space path loss increases with frequency:

Where:
d = Distance in kilometers
f = Frequency in MHz
FSPL = Free-space path loss in dB
Higher frequency means higher path loss for the same distance. Indoor walls add even more loss.
But the tricky part is this: your phone may latch onto a low-band carrier that gives strong bars, while actual capacity may depend on higher-band carriers that are weaker indoors. If carrier aggregation fails or high-band SINR is poor, speeds can drop despite strong visible signal.
In 5G, this matters even more. A phone may show 5G, but performance depends on whether it is using low-band, mid-band, NSA, SA, carrier aggregation, MIMO layers, and whether the network has enough capacity on that layer.

Why Operators Cannot Simply “Increase Signal”
Many users ask operators to “increase tower power.” In reality, that is not always the solution.
Increasing transmit power can improve coverage, but it can also increase interference for neighboring cells. In cellular networks, capacity comes from controlled frequency reuse, careful antenna tilts, sectorization, power planning, and interference management.
If every site transmits louder, the network may become noisier. The result can be worse SINR, more retransmissions, lower spectral efficiency, and poorer user experience.
Telecom engineers usually optimize using a balance of:
Antenna azimuth and electrical tilt,
PCI and neighbor planning,
Power control,
Load balancing,
Carrier aggregation strategy,
Spectrum refarming,
Small cells,
Indoor systems,
Backhaul expansion,
and site densification.
This is why network improvement is expensive and slow. It is not just a software toggle. It may require new fiber routes, new permissions, additional spectrum, tower space, radio units, power upgrades, and physical optimization.
What Users Can Actually Check
For normal users, signal bars are not enough. A better diagnosis includes:
Speed test during peak and off-peak hours,
Indoor vs outdoor comparison,
LTE/5G band information,
RSRP, RSRQ, and SINR values,
Upload speed and latency,
Packet loss or jitter,
Whether the issue happens only in one area,
Whether multiple users on the same operator face it.
For engineers, the useful question is not “how many bars?” but:
Is the bottleneck radio coverage, radio quality, scheduler load, spectrum capacity, transport backhaul, or core-network congestion?
A strong field test would compare RSRP, SINR, CQI, MCS, PRB utilization, throughput, latency, and handover behavior across time and location.
Full Bars Mean You Are Connected, Not That the Network Is Free
Full signal bars are only the start of the story. They tell you that your phone can hear the tower, but they do not reveal whether the signal is clean, whether the cell is overloaded, whether enough spectrum is available, whether backhaul is strong, or whether indoor conditions are damaging SINR.
In India, slow internet with full signal is especially common because mobile networks carry enormous traffic across dense cities, apartments, markets, transport hubs, and indoor environments. The real limitation is often not coverage but capacity and quality.
A good mobile network is not built by signal strength alone. It needs the right spectrum, clean RF planning, strong backhaul, dense site deployment, intelligent scheduling, and enough capacity where people actually use data. That is why the phrase “full signal but slow internet” is not a contradiction. It is a reminder that modern telecom performance is a full system problem, not a signal-bar problem.


Comments